Simulator Installation Instructions
In order to simulate verilog code, both a simulator and waveform viewing tool need to be installed. A collection of programs useful for both IC design and FPGA design are hosted and maintained by YosisHQ. To test everything is working, we will use a test design.
These are instructions to setup the open source IC simulation tools locally on your computer. This guide assumes a Windows computer, the tools work on both Mac and Linux as well refer to the installation instructions.
Download/Install prerequisite software
- Install git for Windows: https://git-scm.com/
- Install VS Code: https://code.visualstudio.com/
- Download a release from YosysHQ: https://github.com/YosysHQ/oss-cad-suite-build/releases/
Install OSS-CAD-Suite
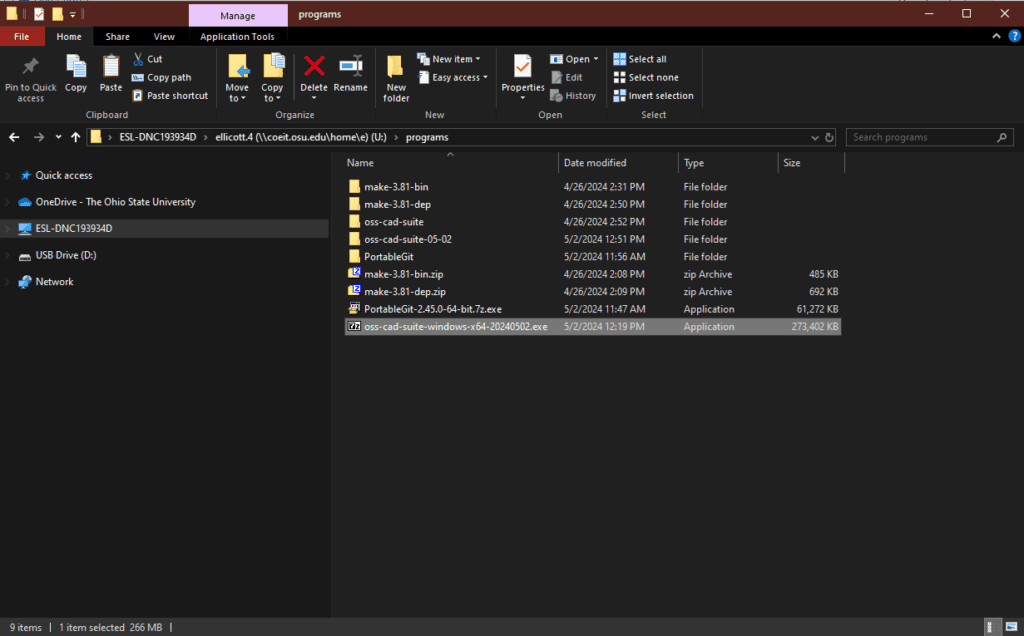
The oss-cad-suite is a portable installation, meaning it doesn’t need administrator access to install anything, instead we need to decompress it to a suitable folder (this allows for running the tools off a flash drive). For various reasons, some of the tools don’t like being installed to a path that includes spaces; usually your ‘Documents’ folder meets this requirement, but be sure to double check. For my examples I am using the path ‘U:\programs\‘.
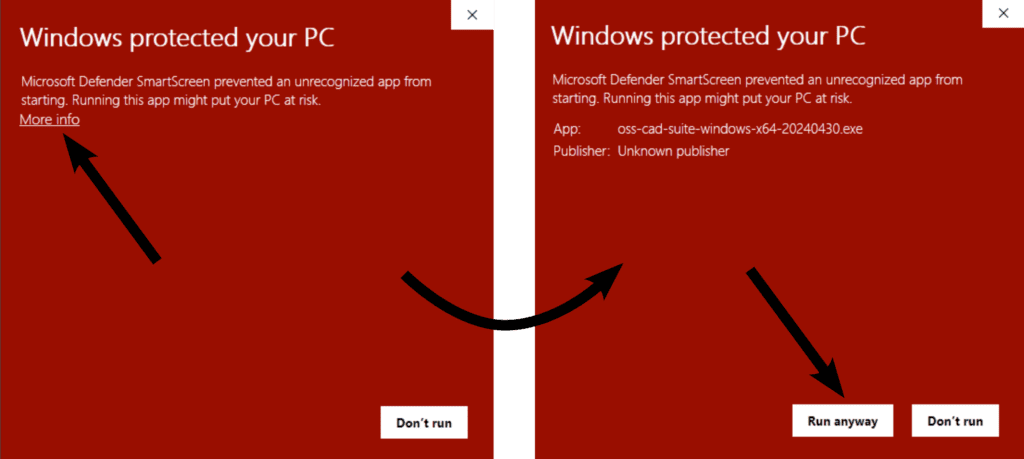
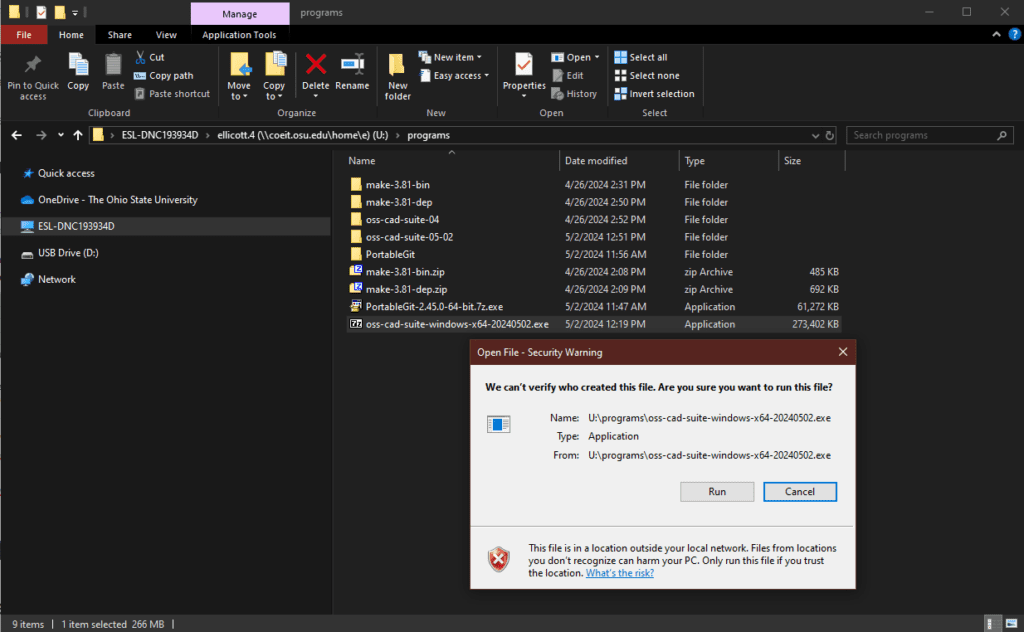
Extract the tools by double clicking on the oss-cad-suite-windows-x64_<version>.exe file that you downloaded. This will prompt a security warning since the download is bundled with a 7z extraction utility. Ignore the warnings and proceed with the installation. The warning comes from the installer not being signed by Microsoft (or a trusted 3rd party).
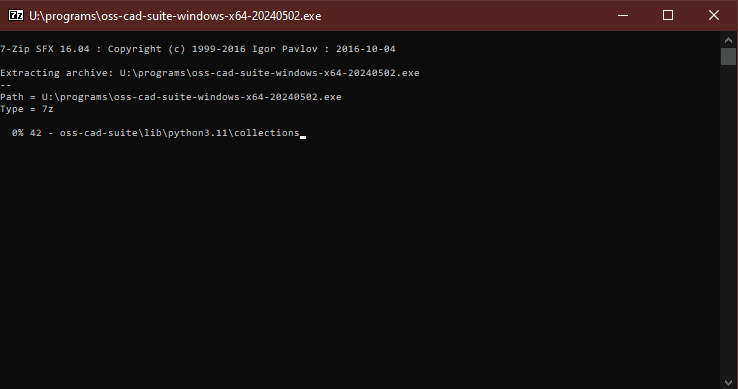
You should now have a folder called ‘oss-cad-suite‘ which contains the tools.
Launch GTKWave
In order to run the tools from the oss-cad-suite, we need to start the oss-cad-suite environment. To do this, double click ‘start.bat’ in the oss-cad-suite folder. In the terminal that was launched, try starting ‘gtkwave’ by running the following into the terminal window:
gtkwave
This should start up gtkwave as seen in the figure below.

Download Test Project
Use git to download the Fibonacci sequence example project from github. You can find the url to paste into git as shown below.

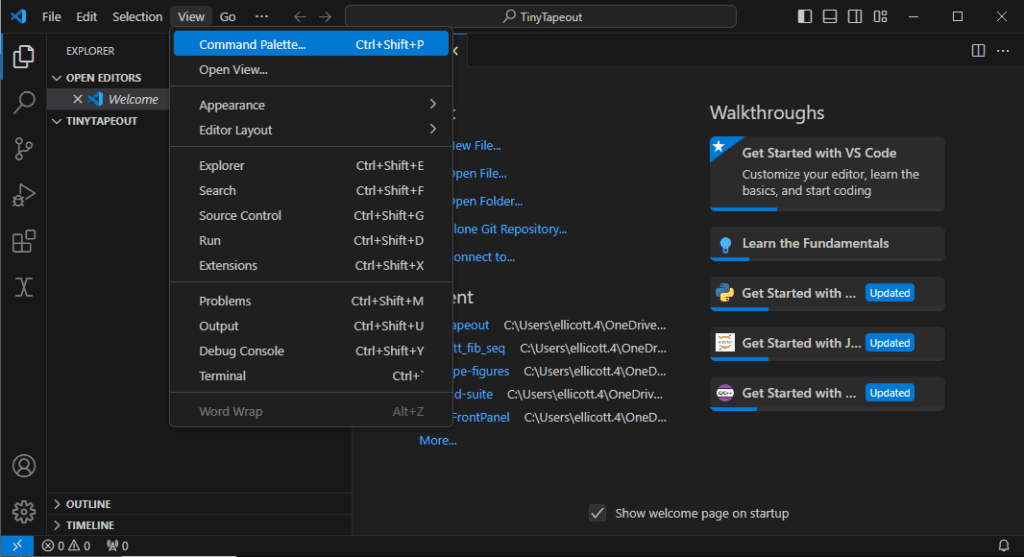
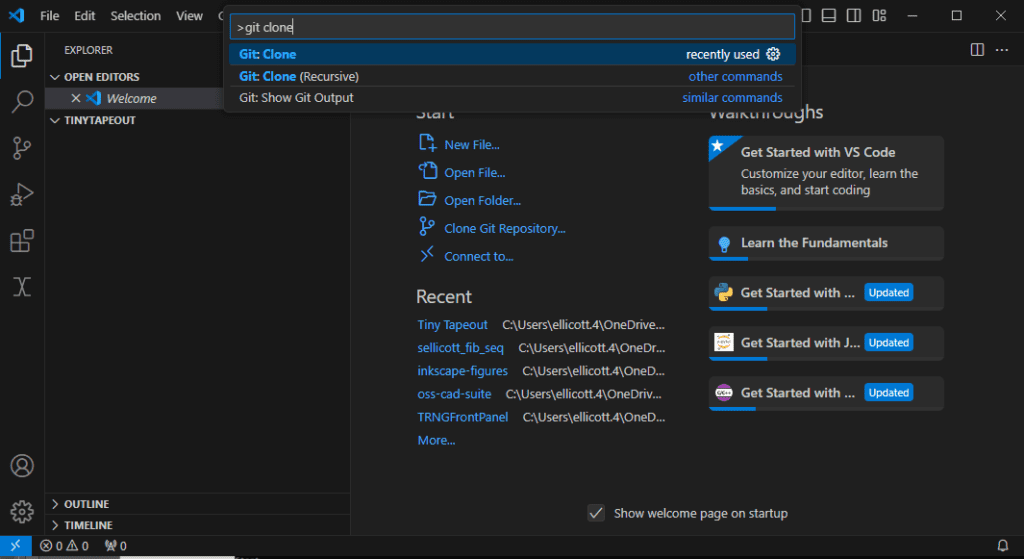
To clone this to your computer open VS Code and use the command palate to download the project.
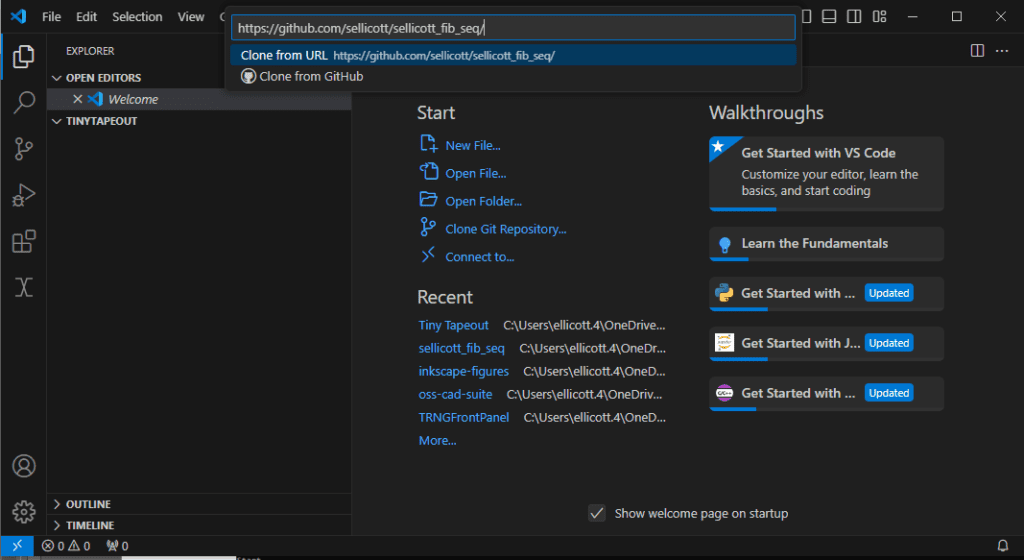
VS Code will ask you where to save the project at. Pick a directory of your choice.
Running Icarus Verilog
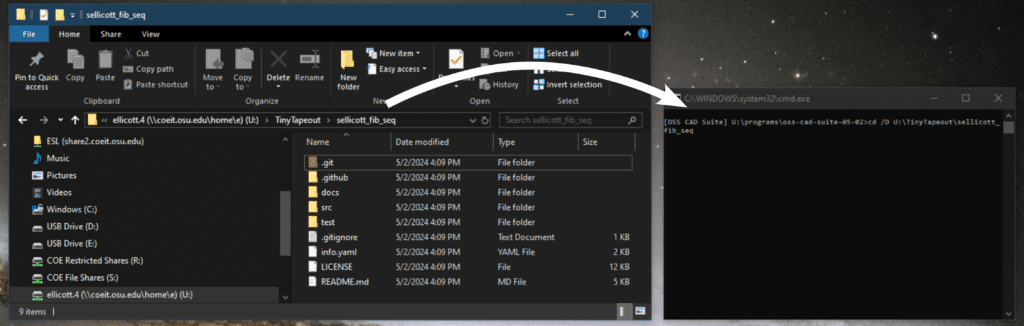
Same as for GTKWave, we need to launch an oss-cad-suite terminal in order to run Icarus Verilog. Once again, double click on ‘start.bat’ from the oss-cad-suite folder. Now we need to navigate that terminal to the directory our source code is in. The command for this is ‘cd <path>’. (Note that if you need to ‘cd’ over drive boundaries you need to use ‘cd /D <path>’ instead.) An easy way to put a path into the terminal is to drag-and-drop a folder into the terminal. This is shown in the figure below.
Now we can run the following commands (assuming you are in the top directory of the Fibonacci sequence project) to simulate and run the design.
iverilog -o tb.vvp -DICARUS test\tb.v src\fib.v src\tt_um_sellicott_fib_seq.v
This should run without any errors. Next, run the following command to simulate the design.
vvp tb.vvp
We should see the following output:
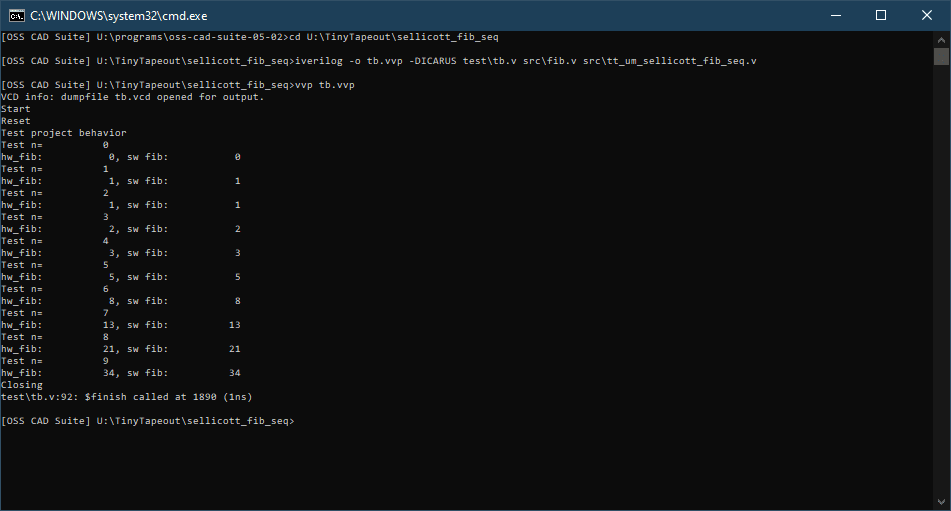
This will generate the file ‘tb.vcd’ in your working directory. You can open it using the command:
gtkwave tb.vcd test\tb.gtkw
This should open GKTWave with the test results:

Tips and Tricks
Elaboration/Synthesis
Yosys is the tool used for HDL elaboration (conversion from code to generic logic gates) and synthesis (conversion from generic logic gates to the process specific standard cells).
https://yosishq.net/yosis/documentation.html. It is included in the oss-cad-suite installed earlier.
Viewing elaborated designs
If you have a verilog file that you want to view as a block diagram, that can be generated using the following commands with Yosys:
yosys -p "prep -top my_top_module; write_json output.json" input1.v input2.v
This will generate a JSON representation of the circuit you can use to generate a diagram using netlistsvg. (Yosys also can generate Graphviz dot files directly, but (on Windows) doesn’t include the program convert them into common formats. I also think they are sort of ugly.)
For example, using the Fibonacci sequence generator Tiny Tapeout project, the preceding command would be:
[OSS CAD Suite] C:\<...>\sellicott_fib_seq\src>yosys -p "prep -top tt_um_sellicott_fib_seq; write_json output.json" tt_um_sellicott_fib_seq.v fib.v
The output.json file can be pasted into the netlistsvg web demo to generate a figure. This tool can also be installed locally, but it requires installing several things beforehand. For more details, see the netlistsvg installation instructions.
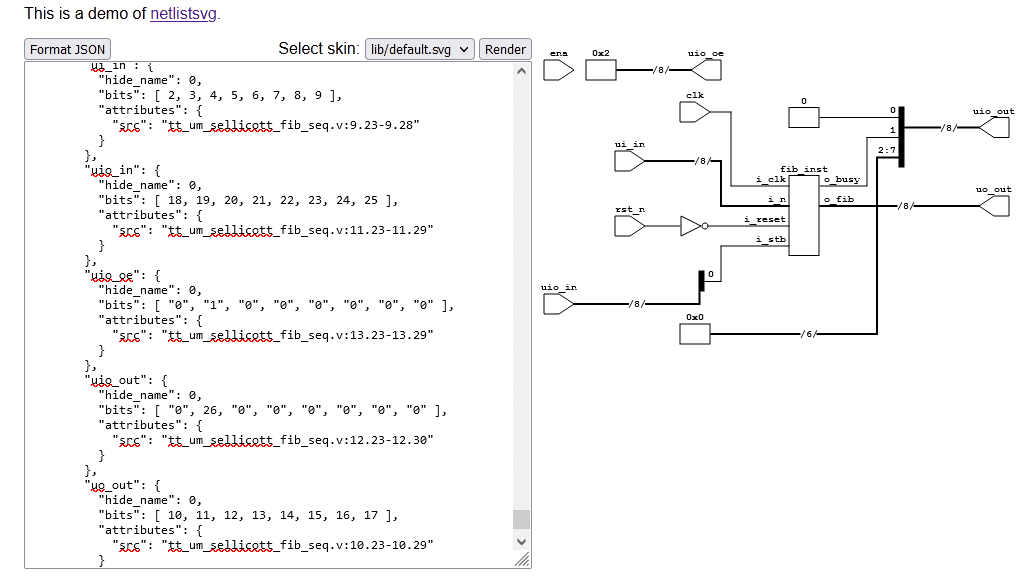
This shows the top level of the project, to see the internals of the “fib_inst” module, we have two options.
- We can apply the same procedure as above, just targeting the “fib” module as being the top-level module
- Alternately, we can “flatten” the top level module, this would show the internals of all the submodules in the project. In this case, there is only one submodule; show only it’s internals will be shown.
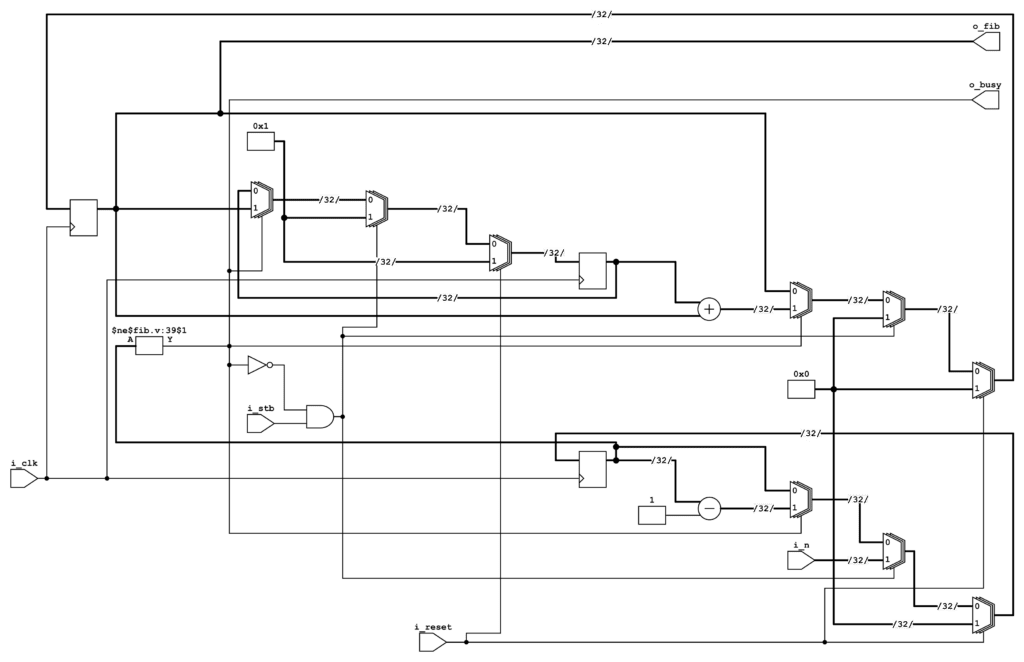
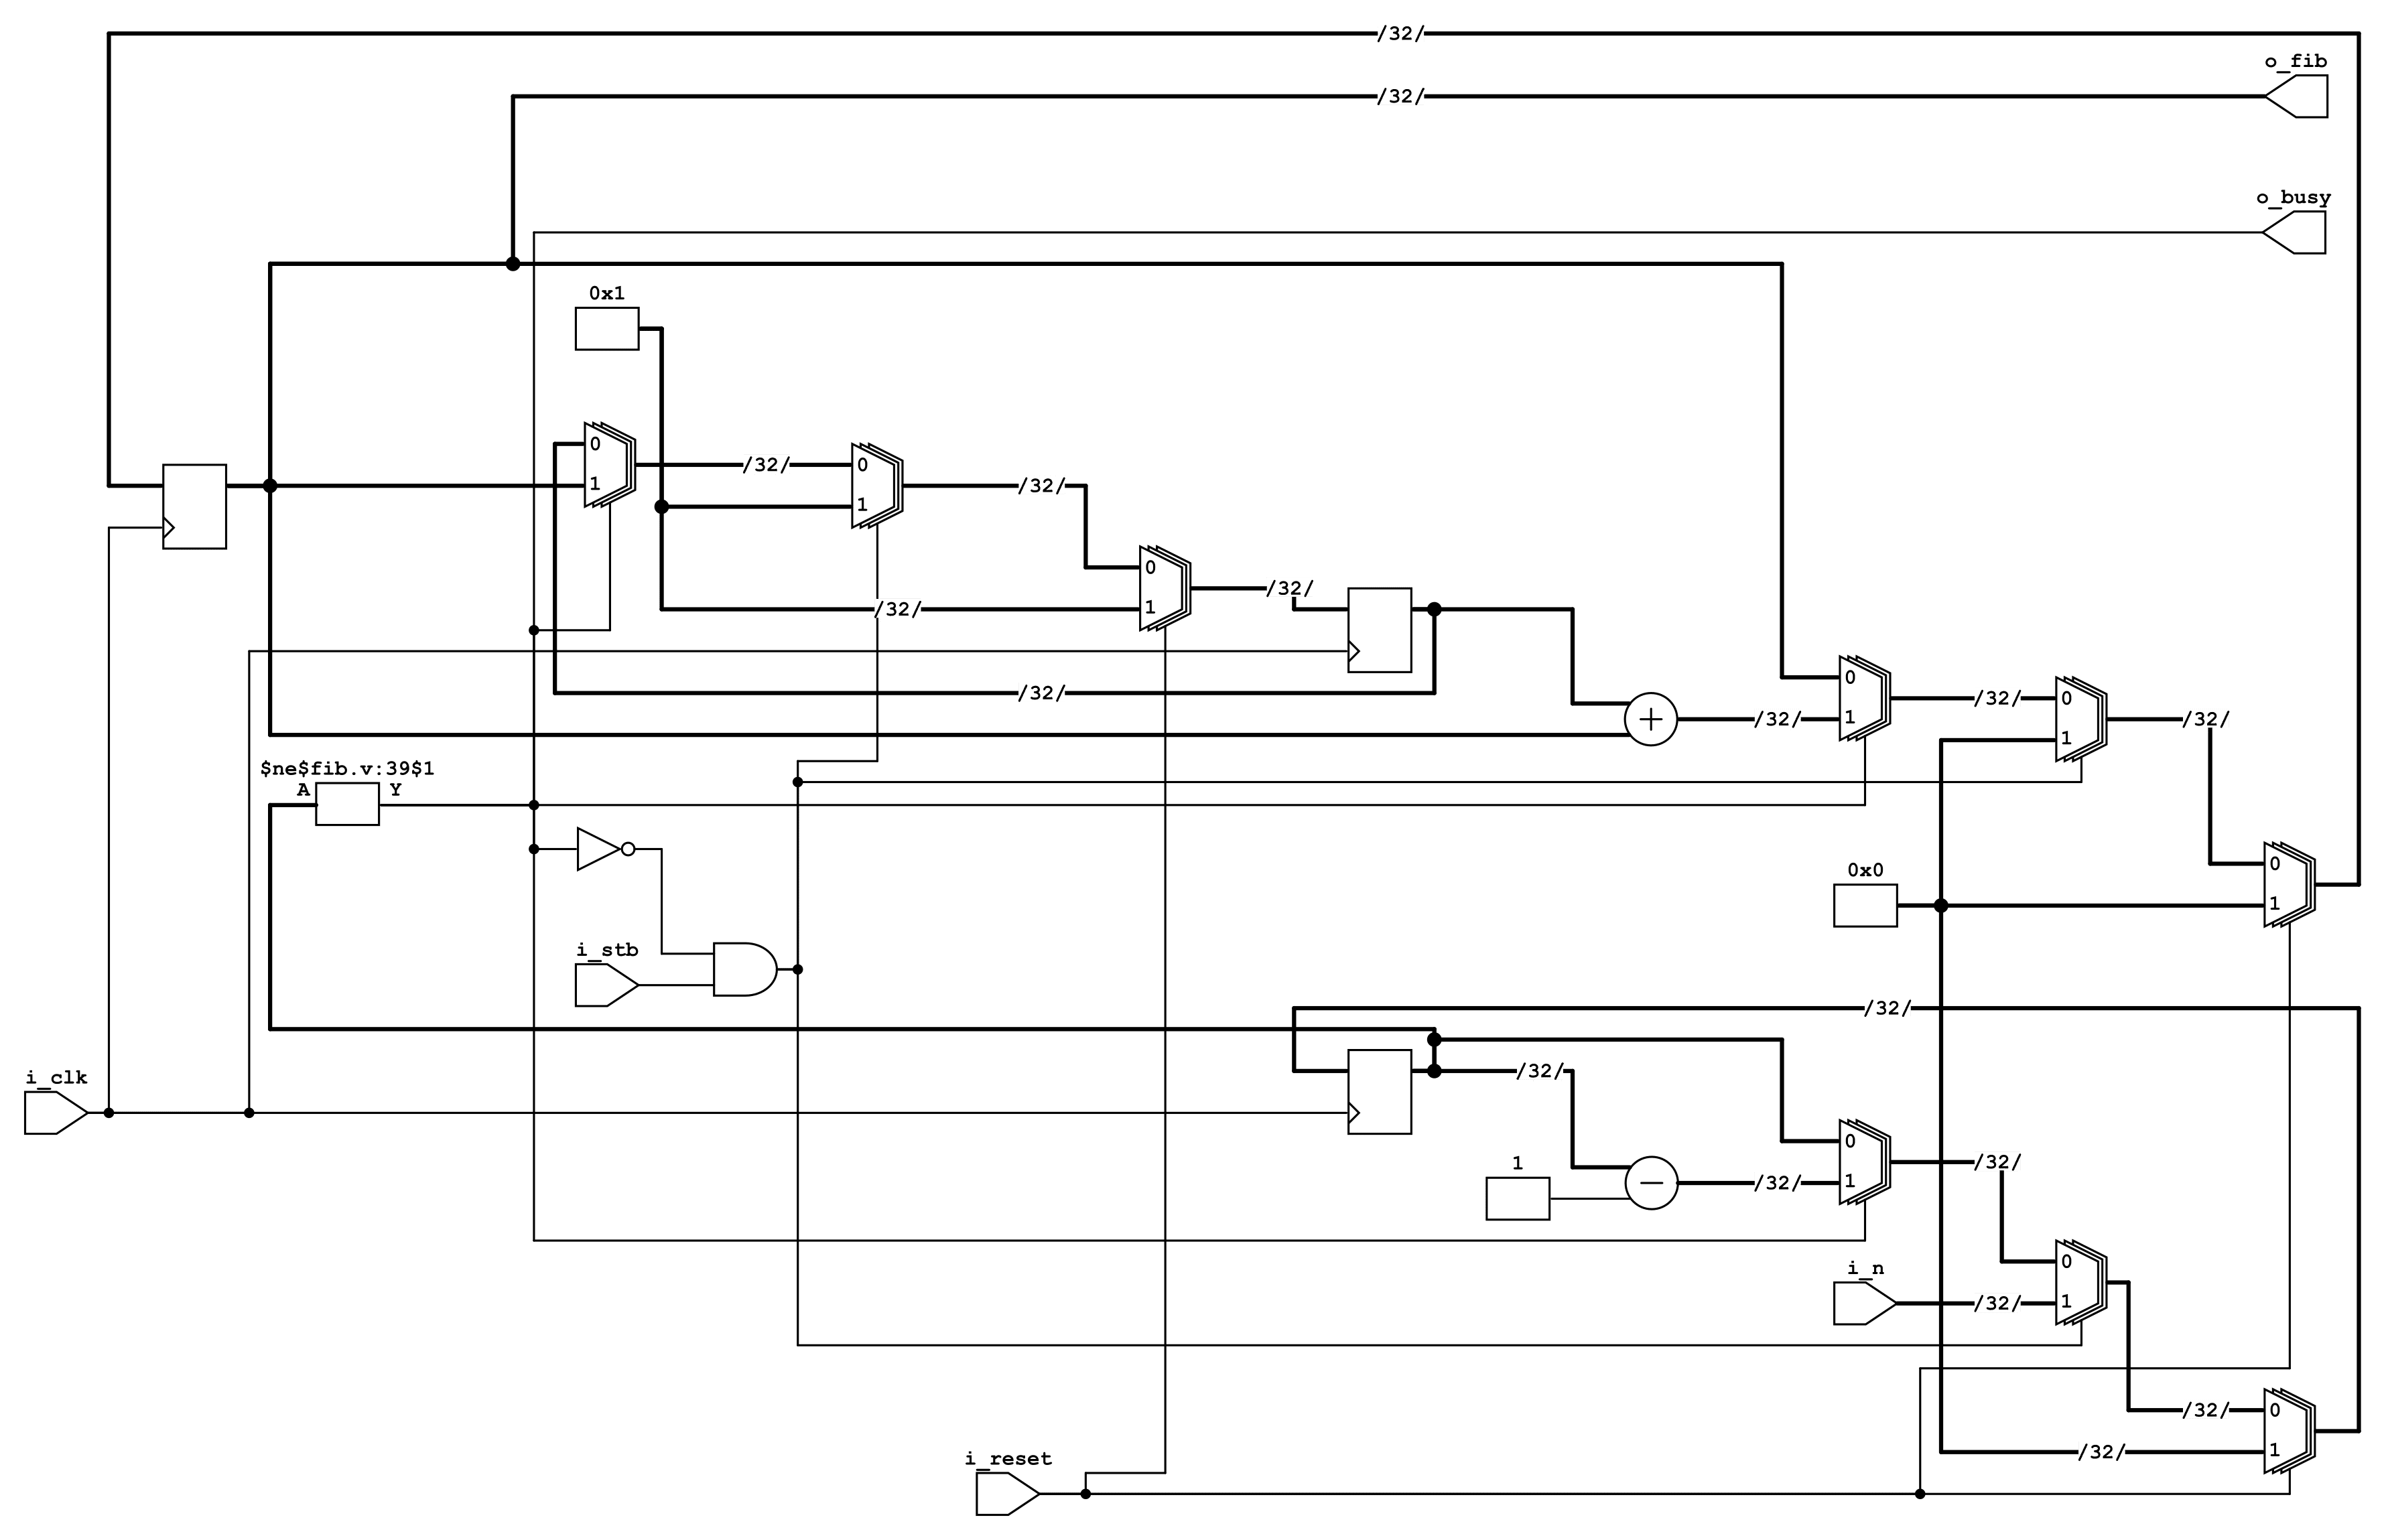
Elaborated schematic of the ‘fib’ module used to generate the Fibonacci sequence from the Tiny Tapeout example project. 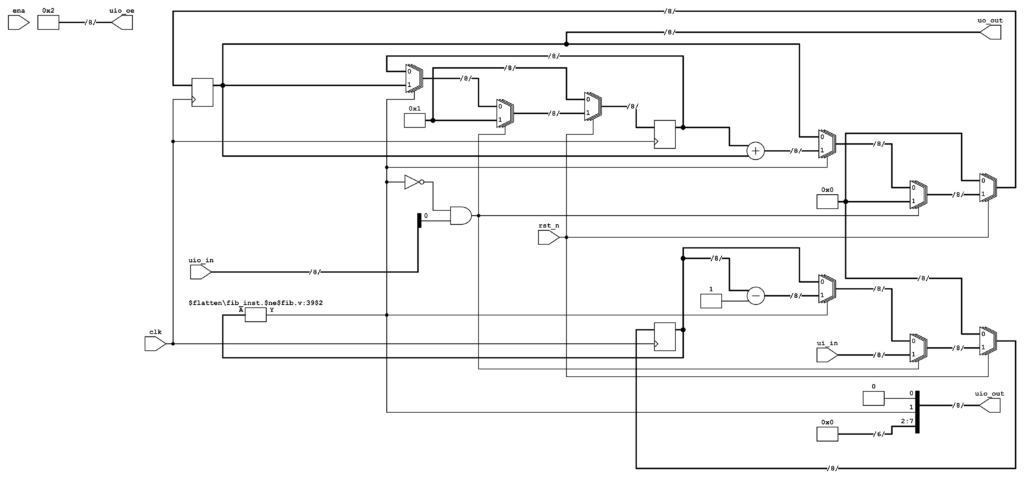
Flattened Fibonacci sequence example project schematic.

The flattened diagram was generated by the command:
[OSS CAD Suite] C:\<...>\sellicott_fib_seq\src>yosys -p "prep -top tt_um_sellicott_fib_seq -flatten; write_json output.json" tt_um_sellicott_fib_seq.v fib.v
Note that the main difference between the two schematics is that the flattened diagram shows the connections to the top level module pins, while the schematic for the submodule displays the submodule pins. Additionally, as mentioned previously, the flattened view would show the schematic for all the submodules in the top level diagram had they existed.